Web Server Statistics for estate.trademore.com.ng

Program started on Sun, Sep 20 2020 at 1:15 PM.
Analyzed requests from Mon, Sep 07 2020 at 5:15 PM to Sat, Sep 19 2020 at 10:55 PM (12.24 days).

General Summary

(Go To: Top | General Summary | Monthly Report | Daily Summary | Hourly Summary | Domain Report | Organization Report | Failed Referrer Report | Browser Report | Browser Summary | Operating System Report | Status Code Report | File Size Report | File Type Report | Directory Report | Request Report)

Figures in parentheses refer to the 7-day period ending Sep 20 2020 at 1:15 PM.

Successful requests: 15 (4)
Average successful requests per day: 1 (0)
Successful requests for pages: 15 (4)
Average successful requests for pages per day: 1 (0)
Failed requests: 7 (1)
Distinct files requested: 1 (7)
Distinct hosts served: 7 (7)
Data transferred: 920.06 kilobytes (245.58 kilobytes)
Average data transferred per day: 75.19 kilobytes (35.08 kilobytes)

Monthly Report

(Go To: Top | General Summary | Monthly Report | Daily Summary | Hourly Summary | Domain Report | Organization Report | Failed Referrer Report | Browser Report | Browser Summary | Operating System Report | Status Code Report | File Size Report | File Type Report | Directory Report | Request Report)

Each unit (+) represents 1 request for a page.
month#reqs#pages 
Sep 20201515+++++++++++++++

Busiest month: Sep 2020 (15 requests for pages).

Daily Summary

(Go To: Top | General Summary | Monthly Report | Daily Summary | Hourly Summary | Domain Report | Organization Report | Failed Referrer Report | Browser Report | Browser Summary | Operating System Report | Status Code Report | File Size Report | File Type Report | Directory Report | Request Report)

Each unit (+) represents 1 request for a page.
day#reqs#pages 
Sun00
Mon99+++++++++
Tue22++
Wed00
Thu11+
Fri22++
Sat11+

Hourly Summary

(Go To: Top | General Summary | Monthly Report | Daily Summary | Hourly Summary | Domain Report | Organization Report | Failed Referrer Report | Browser Report | Browser Summary | Operating System Report | Status Code Report | File Size Report | File Type Report | Directory Report | Request Report)

Each unit (+) represents 1 request for a page.
hour#reqs#pages 
022++
100
200
300
400
500
600
700
800
900
1000
1111+
1211+
1300
1400
1500
1600
1799+++++++++
1800
1900
2000
2100
2211+
2311+

Domain Report

(Go To: Top | General Summary | Monthly Report | Daily Summary | Hourly Summary | Domain Report | Organization Report | Failed Referrer Report | Browser Report | Browser Summary | Operating System Report | Status Code Report | File Size Report | File Type Report | Directory Report | Request Report)

Listing domains, sorted by the amount of traffic.

#reqs%bytesdomain
15100%[unresolved numerical addresses]

Organization Report

(Go To: Top | General Summary | Monthly Report | Daily Summary | Hourly Summary | Domain Report | Organization Report | Failed Referrer Report | Browser Report | Browser Summary | Operating System Report | Status Code Report | File Size Report | File Type Report | Directory Report | Request Report)

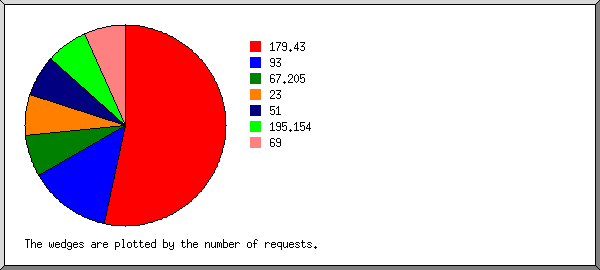
Listing organizations, sorted by the number of requests.

#reqs%bytesorganization
853.31%179.43
213.35%93
1 6.66%67.205
1 6.67%23
1 6.67%51
1 6.66%195.154
1 6.68%69

Failed Referrer Report

(Go To: Top | General Summary | Monthly Report | Daily Summary | Hourly Summary | Domain Report | Organization Report | Failed Referrer Report | Browser Report | Browser Summary | Operating System Report | Status Code Report | File Size Report | File Type Report | Directory Report | Request Report)

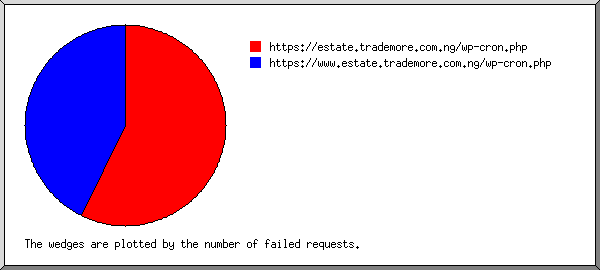
Listing referring URLs, sorted by the number of failed requests.

#reqsURL
4https://estate.trademore.com.ng/wp-cron.php
3https://www.estate.trademore.com.ng/wp-cron.php

Browser Report

(Go To: Top | General Summary | Monthly Report | Daily Summary | Hourly Summary | Domain Report | Organization Report | Failed Referrer Report | Browser Report | Browser Summary | Operating System Report | Status Code Report | File Size Report | File Type Report | Directory Report | Request Report)

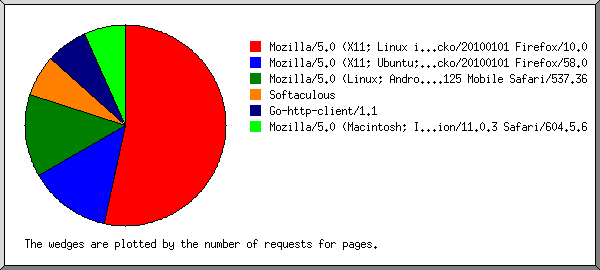
Listing browsers with at least 1 request for a page, sorted by the number of requests for pages.

#reqs#pagesbrowser
88Mozilla/5.0 (X11; Linux i686; rv:10.0) Gecko/20100101 Firefox/10.0
22Mozilla/5.0 (X11; Ubuntu; Linux x86_64; rv:58.0) Gecko/20100101 Firefox/58.0
22Mozilla/5.0 (Linux; Android 7.0; SM-G930V Build/NRD90M) AppleWebKit/537.36 (KHTML, like Gecko) Chrome/59.0.3071.125 Mobile Safari/537.36
11Softaculous
11Go-http-client/1.1
11Mozilla/5.0 (Macintosh; Intel Mac OS X 10_12_6) AppleWebKit/604.5.6 (KHTML, like Gecko) Version/11.0.3 Safari/604.5.6

Browser Summary

(Go To: Top | General Summary | Monthly Report | Daily Summary | Hourly Summary | Domain Report | Organization Report | Failed Referrer Report | Browser Report | Browser Summary | Operating System Report | Status Code Report | File Size Report | File Type Report | Directory Report | Request Report)

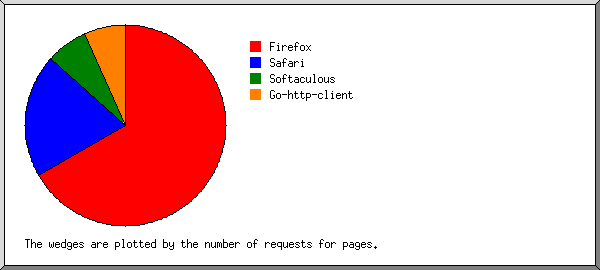
Listing browsers with at least 1 request for a page, sorted by the number of requests for pages.

##reqs#pagesbrowser
11010Firefox
 88  Firefox/10
 22  Firefox/58
233Safari
 22  Safari/537
 11  Safari/604
311Softaculous
411Go-http-client
 11  Go-http-client/1

Operating System Report

(Go To: Top | General Summary | Monthly Report | Daily Summary | Hourly Summary | Domain Report | Organization Report | Failed Referrer Report | Browser Report | Browser Summary | Operating System Report | Status Code Report | File Size Report | File Type Report | Directory Report | Request Report)

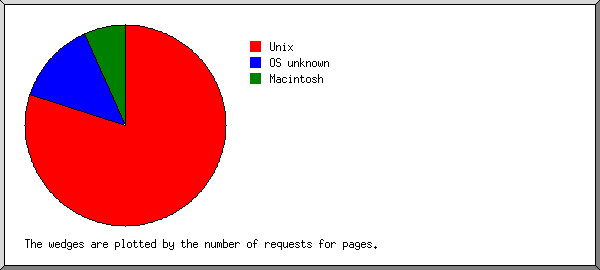
Listing operating systems, sorted by the number of requests for pages.

##reqs#pagesOS
11212Unix
 1212  Linux
222OS unknown
311Macintosh

Status Code Report

(Go To: Top | General Summary | Monthly Report | Daily Summary | Hourly Summary | Domain Report | Organization Report | Failed Referrer Report | Browser Report | Browser Summary | Operating System Report | Status Code Report | File Size Report | File Type Report | Directory Report | Request Report)

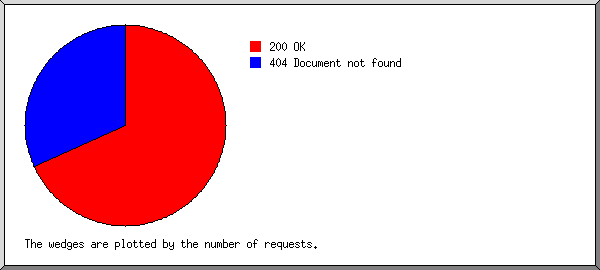
Listing status codes, sorted numerically.

#reqsstatus code
15200 OK
7404 Document not found

File Size Report

(Go To: Top | General Summary | Monthly Report | Daily Summary | Hourly Summary | Domain Report | Organization Report | Failed Referrer Report | Browser Report | Browser Summary | Operating System Report | Status Code Report | File Size Report | File Type Report | Directory Report | Request Report)

size#reqs%bytes
00 
1B- 10B0 
11B- 100B0 
101B- 1kB0 
1kB- 10kB0 
10kB-100kB15100%

File Type Report

(Go To: Top | General Summary | Monthly Report | Daily Summary | Hourly Summary | Domain Report | Organization Report | Failed Referrer Report | Browser Report | Browser Summary | Operating System Report | Status Code Report | File Size Report | File Type Report | Directory Report | Request Report)

Listing extensions with at least 0.1% of the traffic, sorted by the amount of traffic.

#reqs%bytesextension
15100%[directories]

Directory Report

(Go To: Top | General Summary | Monthly Report | Daily Summary | Hourly Summary | Domain Report | Organization Report | Failed Referrer Report | Browser Report | Browser Summary | Operating System Report | Status Code Report | File Size Report | File Type Report | Directory Report | Request Report)

Listing directories with at least 0.01% of the traffic, sorted by the amount of traffic.

#reqs%bytesdirectory
15100%[root directory]

Request Report

(Go To: Top | General Summary | Monthly Report | Daily Summary | Hourly Summary | Domain Report | Organization Report | Failed Referrer Report | Browser Report | Browser Summary | Operating System Report | Status Code Report | File Size Report | File Type Report | Directory Report | Request Report)

Listing files with at least 20 requests, sorted by the number of requests.

#reqs%byteslast timefile
15100%Sep/19/20 10:55 PM[not listed: 1 file]