 Web Server Statistics for cl.trademore.com.ng
Program started on Thu, Dec 31 2020 at 1:16 PM.
Analyzed requests from Thu, Oct 08 2020 at 6:50 AM to Thu, Dec 31 2020 at 10:56 AM (84.17 days).
Web Server Statistics for cl.trademore.com.ngProgram started on Thu, Dec 31 2020 at 1:16 PM.
Analyzed requests from Thu, Oct 08 2020 at 6:50 AM to Thu, Dec 31 2020 at 10:56 AM (84.17 days).
(Go To: Top | General Summary | Monthly Report | Daily Summary | Hourly Summary | Domain Report | Organization Report | Failed Referrer Report | Browser Report | Browser Summary | Operating System Report | Status Code Report | File Size Report | File Type Report | Directory Report | Request Report)
Figures in parentheses refer to the 7-day period ending Dec 31 2020 at 1:16 PM.
Successful requests: 34 (3)
Successful requests for pages: 14 (3)
Failed requests: 63 (1)
Redirected requests: 7 (0)
Distinct files requested: 11 (54)
Distinct hosts served: 20 (45)
Data transferred: 10.13 kilobytes (1.83 kilobytes)
Average data transferred per day: 123 bytes (267 bytes)
(Go To: Top | General Summary | Monthly Report | Daily Summary | Hourly Summary | Domain Report | Organization Report | Failed Referrer Report | Browser Report | Browser Summary | Operating System Report | Status Code Report | File Size Report | File Type Report | Directory Report | Request Report)
Each unit ( ) represents 1 request for a page.
| month | #reqs | #pages | |
|---|---|---|---|
| Oct 2020 | 10 | 0 | |
| Nov 2020 | 0 | 0 | |
| Dec 2020 | 24 | 14 |    |
Busiest month: Dec 2020 (14 requests for pages).
(Go To: Top | General Summary | Monthly Report | Daily Summary | Hourly Summary | Domain Report | Organization Report | Failed Referrer Report | Browser Report | Browser Summary | Operating System Report | Status Code Report | File Size Report | File Type Report | Directory Report | Request Report)
Each unit () represents 1 request for a page.
| day | #reqs | #pages | |
|---|---|---|---|
| Sun | 2 | 2 | |
| Mon | 1 | 1 | |
| Tue | 11 | 1 | |
| Wed | 2 | 2 | |
| Thu | 13 | 3 | |
| Fri | 2 | 2 | |
| Sat | 3 | 3 | |
(Go To: Top | General Summary | Monthly Report | Daily Summary | Hourly Summary | Domain Report | Organization Report | Failed Referrer Report | Browser Report | Browser Summary | Operating System Report | Status Code Report | File Size Report | File Type Report | Directory Report | Request Report)
Each unit () represents 1 request for a page.
| hour | #reqs | #pages | |
|---|---|---|---|
| 0 | 1 | 1 | |
| 1 | 0 | 0 | |
| 2 | 0 | 0 | |
| 3 | 0 | 0 | |
| 4 | 0 | 0 | |
| 5 | 0 | 0 | |
| 6 | 10 | 0 | |
| 7 | 10 | 0 | |
| 8 | 0 | 0 | |
| 9 | 1 | 1 | |
| 10 | 2 | 2 | |
| 11 | 0 | 0 | |
| 12 | 2 | 2 | |
| 13 | 0 | 0 | |
| 14 | 0 | 0 | |
| 15 | 2 | 2 | |
| 16 | 1 | 1 | |
| 17 | 1 | 1 | |
| 18 | 0 | 0 | |
| 19 | 1 | 1 | |
| 20 | 2 | 2 | |
| 21 | 0 | 0 | |
| 22 | 1 | 1 | |
| 23 | 0 | 0 |
(Go To: Top | General Summary | Monthly Report | Daily Summary | Hourly Summary | Domain Report | Organization Report | Failed Referrer Report | Browser Report | Browser Summary | Operating System Report | Status Code Report | File Size Report | File Type Report | Directory Report | Request Report)
Listing domains, sorted by the amount of traffic.
| #reqs | %bytes | domain |
|---|---|---|
| 34 | 100% | [unresolved numerical addresses] |
(Go To: Top | General Summary | Monthly Report | Daily Summary | Hourly Summary | Domain Report | Organization Report | Failed Referrer Report | Browser Report | Browser Summary | Operating System Report | Status Code Report | File Size Report | File Type Report | Directory Report | Request Report)

Listing organizations, sorted by the number of requests.
| #reqs | %bytes | organization |
|---|---|---|
| 11 | 66.08% | 209.17 |
| 4 | 2.47% | 23 |
| 4 | 3.36% | 34 |
| 4 | 3.36% | 18 |
| 4 | 3.36% | 3 |
| 2 | 1.68% | 64.78 |
| 2 | 12.02% | 35 |
| 2 | 1.68% | 66.133 |
| 1 | 6.01% | 52 |
(Go To: Top | General Summary | Monthly Report | Daily Summary | Hourly Summary | Domain Report | Organization Report | Failed Referrer Report | Browser Report | Browser Summary | Operating System Report | Status Code Report | File Size Report | File Type Report | Directory Report | Request Report)
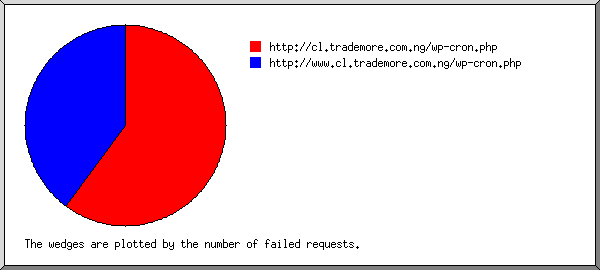
Listing referring URLs, sorted by the number of failed requests.
| #reqs | URL |
|---|---|
| 3 | http://cl.trademore.com.ng/wp-cron.php |
| 2 | http://www.cl.trademore.com.ng/wp-cron.php |
(Go To: Top | General Summary | Monthly Report | Daily Summary | Hourly Summary | Domain Report | Organization Report | Failed Referrer Report | Browser Report | Browser Summary | Operating System Report | Status Code Report | File Size Report | File Type Report | Directory Report | Request Report)
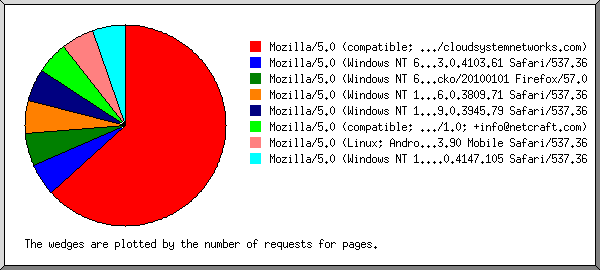
Listing browsers with at least 1 request for a page, sorted by the number of requests for pages.
| #reqs | #pages | browser |
|---|---|---|
| 11 | 11 | Mozilla/5.0 (compatible; Nimbostratus-Bot/v1.3.2; http://cloudsystemnetworks.com) |
| 1 | 1 | Mozilla/5.0 (Windows NT 6.1; rv:57.0) Gecko/20100101 Firefox/57.0 |
| 1 | 1 | Mozilla/5.0 (Linux; Android 5.1.1; SM-J111F) AppleWebKit/537.36 (KHTML, like Gecko) Chrome/73.0.3683.90 Mobile Safari/537.36 |
| 1 | 1 | Mozilla/5.0 (Windows NT 10.0; Win64; x64) AppleWebKit/537.36 (KHTML, like Gecko; compatible; BW/1.1; bit.ly/2W6Px8S) Chrome/84.0.4147.105 Safari/537.36 |
| 20 | 0 | [not listed: 2 browsers] |
(Go To: Top | General Summary | Monthly Report | Daily Summary | Hourly Summary | Domain Report | Organization Report | Failed Referrer Report | Browser Report | Browser Summary | Operating System Report | Status Code Report | File Size Report | File Type Report | Directory Report | Request Report)
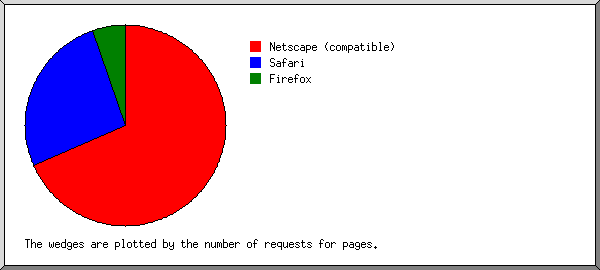
Listing browsers with at least 1 request for a page, sorted by the number of requests for pages.
| # | #reqs | #pages | browser |
|---|---|---|---|
| 1 | 27 | 11 | Netscape (compatible) |
| 2 | 2 | 2 | Safari |
| 2 | 2 | Safari/537 | |
| 3 | 1 | 1 | Firefox |
| 1 | 1 | Firefox/57 | |
| 4 | 0 | [not listed: 1 browser] |
(Go To: Top | General Summary | Monthly Report | Daily Summary | Hourly Summary | Domain Report | Organization Report | Failed Referrer Report | Browser Report | Browser Summary | Operating System Report | Status Code Report | File Size Report | File Type Report | Directory Report | Request Report)
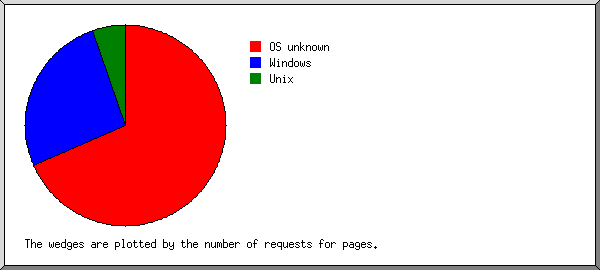
Listing operating systems, sorted by the number of requests for pages.
| # | #reqs | #pages | OS |
|---|---|---|---|
| 1 | 31 | 11 | OS unknown |
| 2 | 2 | 2 | Windows |
| 1 | 1 | Windows NT | |
| 1 | 1 | Unknown Windows | |
| 3 | 1 | 1 | Unix |
| 1 | 1 | Linux |
(Go To: Top | General Summary | Monthly Report | Daily Summary | Hourly Summary | Domain Report | Organization Report | Failed Referrer Report | Browser Report | Browser Summary | Operating System Report | Status Code Report | File Size Report | File Type Report | Directory Report | Request Report)

Listing status codes, sorted numerically.
| #reqs | status code |
|---|---|
| 34 | 200 OK |
| 7 | 301 Document moved permanently |
| 63 | 404 Document not found |
(Go To: Top | General Summary | Monthly Report | Daily Summary | Hourly Summary | Domain Report | Organization Report | Failed Referrer Report | Browser Report | Browser Summary | Operating System Report | Status Code Report | File Size Report | File Type Report | Directory Report | Request Report)
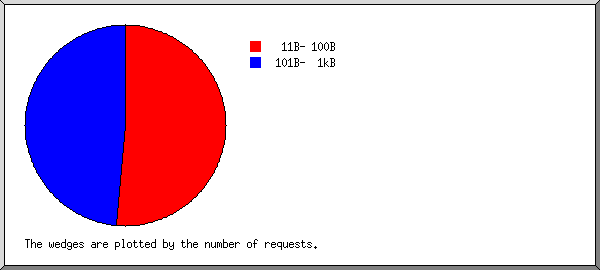
| size | #reqs | %bytes |
|---|---|---|
| 0 | 0 | |
| 1B- 10B | 0 | |
| 11B- 100B | 20 | 15.89% |
| 101B- 1kB | 14 | 84.11% |
(Go To: Top | General Summary | Monthly Report | Daily Summary | Hourly Summary | Domain Report | Organization Report | Failed Referrer Report | Browser Report | Browser Summary | Operating System Report | Status Code Report | File Size Report | File Type Report | Directory Report | Request Report)
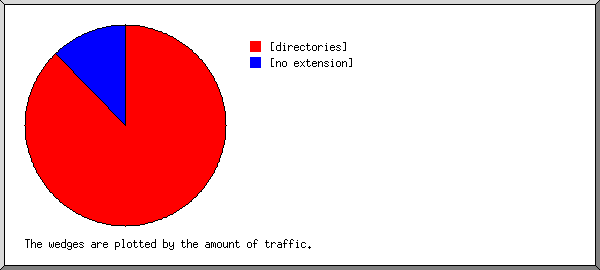
Listing extensions with at least 0.1% of the traffic, sorted by the amount of traffic.
| #reqs | %bytes | extension |
|---|---|---|
| 14 | 84.11% | [directories] |
| 20 | 15.89% | [no extension] |
(Go To: Top | General Summary | Monthly Report | Daily Summary | Hourly Summary | Domain Report | Organization Report | Failed Referrer Report | Browser Report | Browser Summary | Operating System Report | Status Code Report | File Size Report | File Type Report | Directory Report | Request Report)

Listing directories with at least 0.01% of the traffic, sorted by the amount of traffic.
| #reqs | %bytes | directory |
|---|---|---|
| 14 | 84.11% | [root directory] |
| 20 | 15.89% | /.well-known/ |
(Go To: Top | General Summary | Monthly Report | Daily Summary | Hourly Summary | Domain Report | Organization Report | Failed Referrer Report | Browser Report | Browser Summary | Operating System Report | Status Code Report | File Size Report | File Type Report | Directory Report | Request Report)
Listing files with at least 20 requests, sorted by the number of requests.
| #reqs | %bytes | last time | file |
|---|---|---|---|
| 34 | 100% | Dec/31/20 10:56 AM | [not listed: 9 files] |